Monitoring
Monitoring displays key analytics about your server's performance. Available with the Pro subscription, you can enable Monitoring either from Server > Monitoring or by adding it as a service from Server > Services.
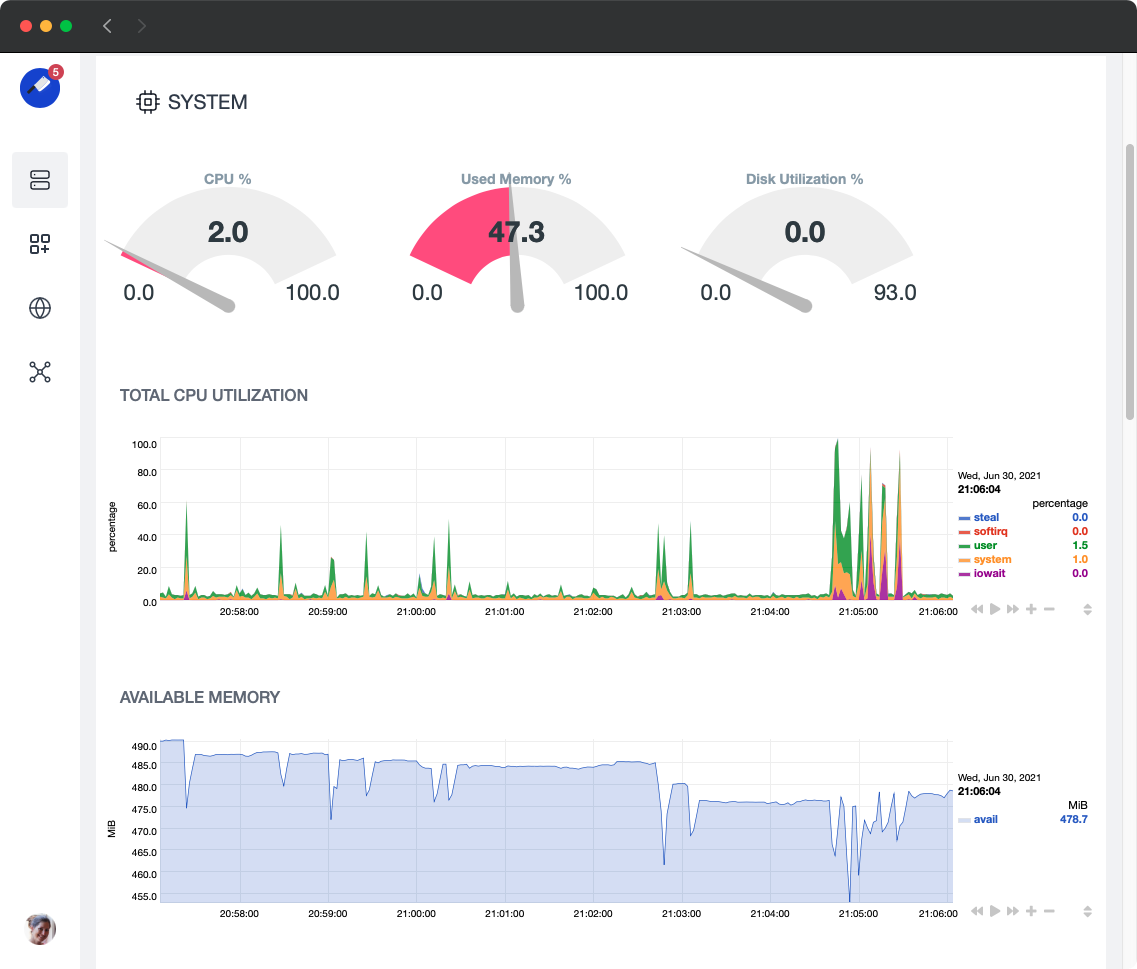
With monitoring enabled, you can view:
- CPU utilization
- Available memory
- Disk space
- Server uptime
- Web requests and types
Monitoring displays historical information graphically and does not include any kind of alert settings or notifications. Cleavr use NetData for monitoring and you can also access the NetData dashboard directly for even more detailed information and features.
Database Monitoring
If you have a database installed on your server as well as system monitoring, then you can optionally enable Database monitoring from the Server > Database section to view key database information.
Database Troubleshooting
If Monitoring does not install correctly and graphs do not display, then try the following:
- Click on the 'Repair' button
- Try uninstalling and reinstalling from the Services section
- Check that port 80 is opened in the Firewall section of the Services page